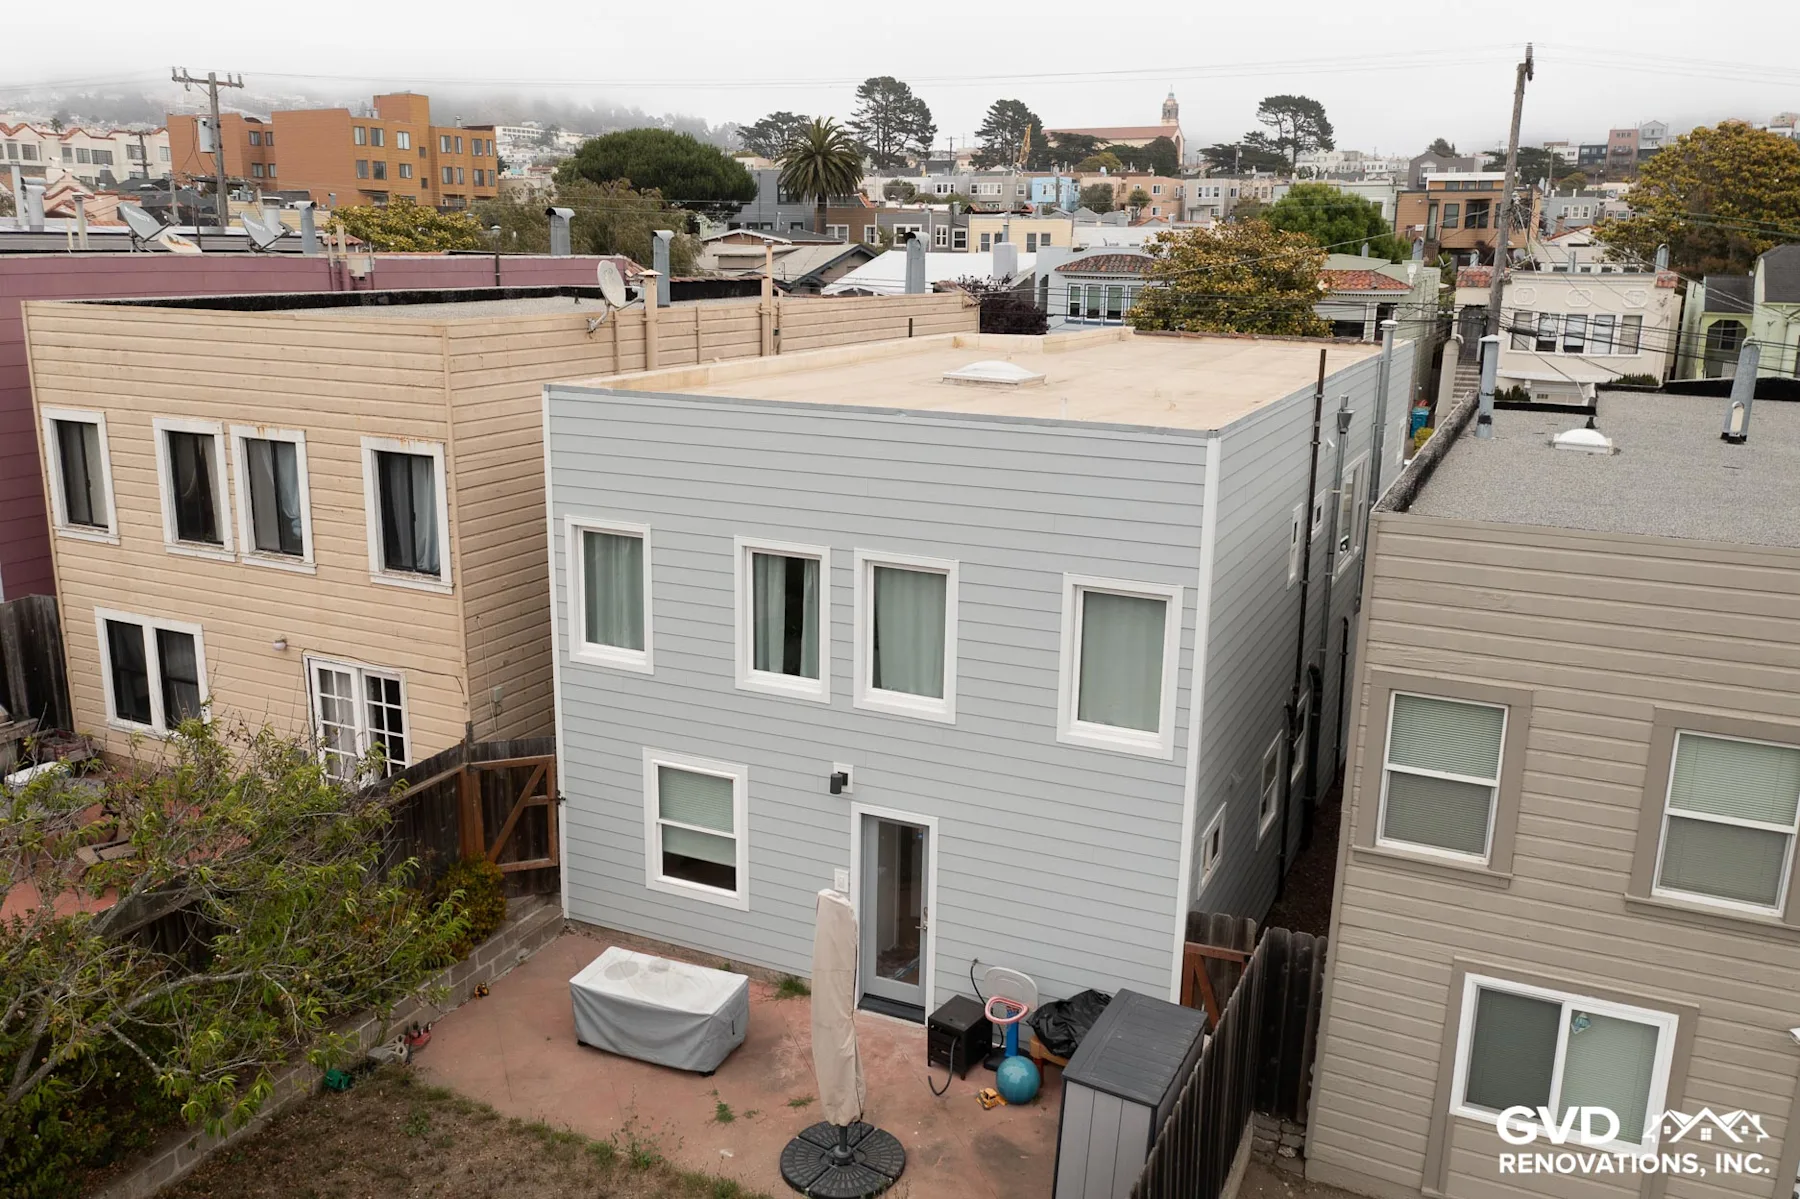
How Old Are Bay Area Homes? Housing Age by County, City and ZIP Code
When were the homes in your Bay Area city built? We counted 3,007,420 homes in all nine counties, down to every city and ZIP code, using the Census Bureau's newest housing survey.
Key numbers
The Bay Area’s housing was mostly built by 1980
The 1970s added the most homes still standing (487,421), and the 1960s and 1950s together added 784,307. More than 432,000 homes date from before 1940: more than were built in the 2000s (257,679) or the 2010s (203,741).
Only 16.6% of today's homes were built in 2000 or later, so most exteriors in the region have had decades of sun, fog and winter rain.
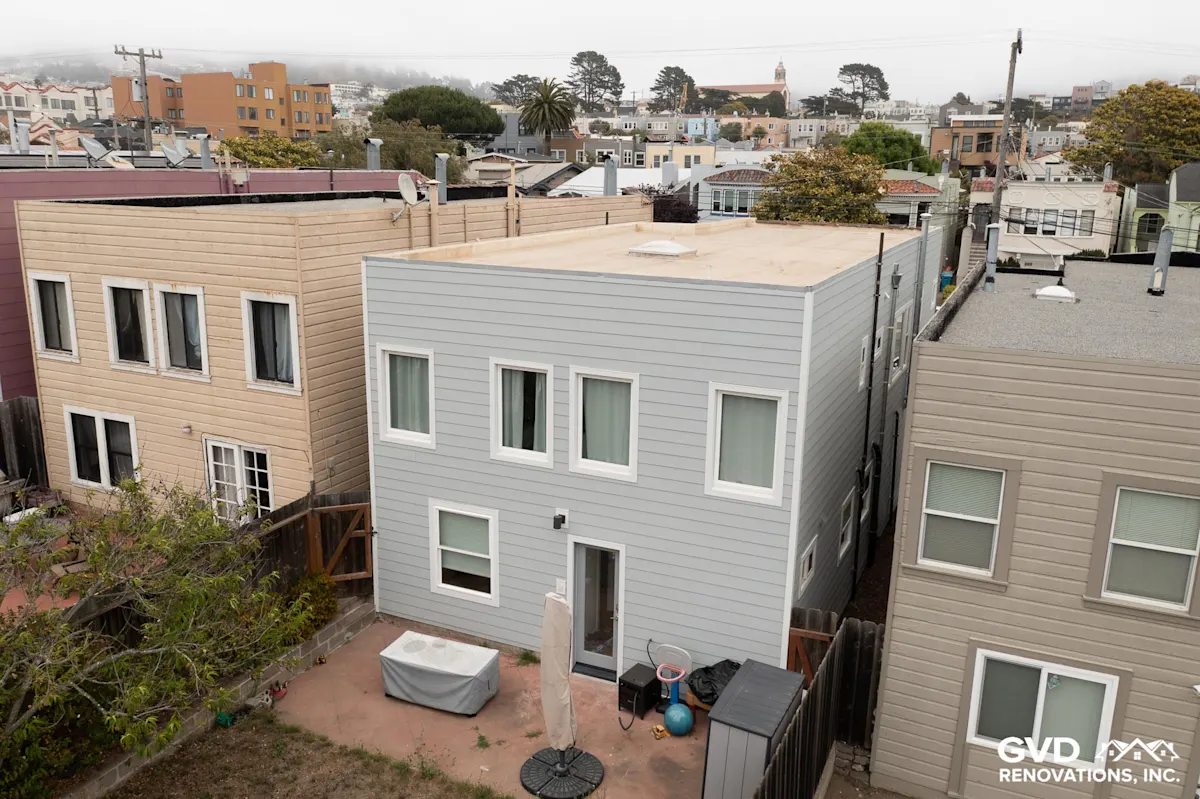
San Francisco, Marin and San Mateo have the oldest homes
76.5% of homes in San Francisco, 74.9% in Marin and 72.5% in San Mateo County were built before 1980. Solano County, which grew later, is the only one of the nine where fewer than half of homes predate 1980 (45.2%).
| County | Homes | Median year built | Built before 1980 | Owner-occupied, before 1980 | Age mix |
|---|---|---|---|---|---|
| Bay Area, all nine counties | 3,007,420 | – | 62.7% | 64.5% | |
| Santa Clara County | 698,837 | 1975 | 59.7% | 66.1% | |
| Alameda County | 637,212 | 1969 | 65.3% | 67.2% | |
| Contra Costa County | 429,260 | 1978 | 53.2% | 54.0% | |
| San Francisco County | 414,602 | 1946 | 76.5% | 79.7% | |
| San Mateo County | 287,184 | 1966 | 72.5% | 77.7% | |
| Sonoma County | 207,699 | 1979 | 52.2% | 53.9% | |
| Solano County | 164,693 | 1982 | 45.2% | 42.1% | |
| Marin County | 112,116 | 1967 | 74.9% | 78.3% | |
| Napa County | 55,817 | 1976 | 57.1% | 60.2% |
The Bay Area row is the sum of the nine counties, so it has no median year built.
Housing age in every Bay Area city and community
The inner East Bay, San Francisco and the Peninsula have the oldest housing: the median home in Berkeley dates to 1944, in Oakland to 1953. San Jose, the largest city, is newer (60.4% before 1980). The newest housing is on the far edges of the region: Brentwood (10.4% before 1980), Oakley (13.8%) and Dublin (19.4%).
| Name | County | Homes | Median year built | Built before 1980 | Built 1980–99 | Age mix |
|---|---|---|---|---|---|---|
| Highlands | San Mateo | 872 | 1959 | 97.5%±8.3 | 2.5% | |
| Bayview (Contra Costa County) | Contra Costa | 863 | 1965 | 97.3%±9.2 | 0.0% | |
| Piedmont | Alameda | 4,073 | 1938 | 95.8%±8.4 | 3.3% | |
| Glen Ellen | Sonoma | 643 | 1956 | 95.6%±84.0 | 0.0% | |
| Woodacre | Marin | 652 | 1954 | 95.4%±11.6 | 4.6% | |
| Ladera | San Mateo | 524 | 1962 | 95.4%±22.9 | 0.0% | |
| Kensington | Contra Costa | 2,207 | 1945 | 94.0%±9.4 | 5.1% | |
| Rollingwood | Contra Costa | 932 | 1953 | 94.0%±17.0 | 1.2% | |
| Baywood Park | San Mateo | 601 | 1961 | 93.7%±15.4 | 5.2% | |
| Montalvin Manor | Contra Costa | 727 | 1958 | 93.4%±14.2 | 1.9% | |
| Broadmoor | San Mateo | 1,431 | 1949 | 92.1%±12.1 | 7.9% | |
| Kenwood | Sonoma | 477 | 1955 | 92.0%±22.5 | 4.2% | |
| Burbank | Santa Clara | 1,973 | 1946 | 91.2%±11.4 | 6.6% | |
| Monte Rio | Sonoma | 774 | 1952 | 91.1%±9.4 | 8.0% | |
| Alum Rock | Santa Clara | 2,896 | 1953 | 90.1%±9.1 | 6.2% | |
| Lucas Valley-Marinwood | Marin | 2,592 | 1964 | 90.0%±10.8 | 7.5% | |
| Santa Venetia | Marin | 1,748 | 1958 | 90.0%±14.6 | 9.6% | |
| Kentfield | Marin | 2,986 | 1956 | 89.5%±7.7 | 5.9% | |
| Fairfax | Marin | 3,417 | 1953 | 87.7%±10.6 | 9.7% | |
| Mountain View | Contra Costa | 1,055 | 1949 | 86.9%±18.1 | 8.2% | |
| Sleepy Hollow | Marin | 1,162 | 1956 | 86.7%±15.1 | 8.3% | |
| Tara Hills | Contra Costa | 1,750 | 1964 | 86.6%±13.3 | 12.7% | |
| San Lorenzo | Alameda | 8,816 | 1955 | 86.5%±5.2 | 7.7% | |
| East Richmond Heights | Contra Costa | 1,440 | 1955 | 86.5%±10.3 | 11.6% | |
| Fruitdale | Santa Clara | 393 | 1953 | 86.5%±25.2 | 7.9% |
"Homes" counts every housing unit, including vacant ones. ± is the 90% margin of error on the share built before 1980. Places with fewer than 300 homes are left out because their estimates are too uncertain. Linked names go to our page for that city.
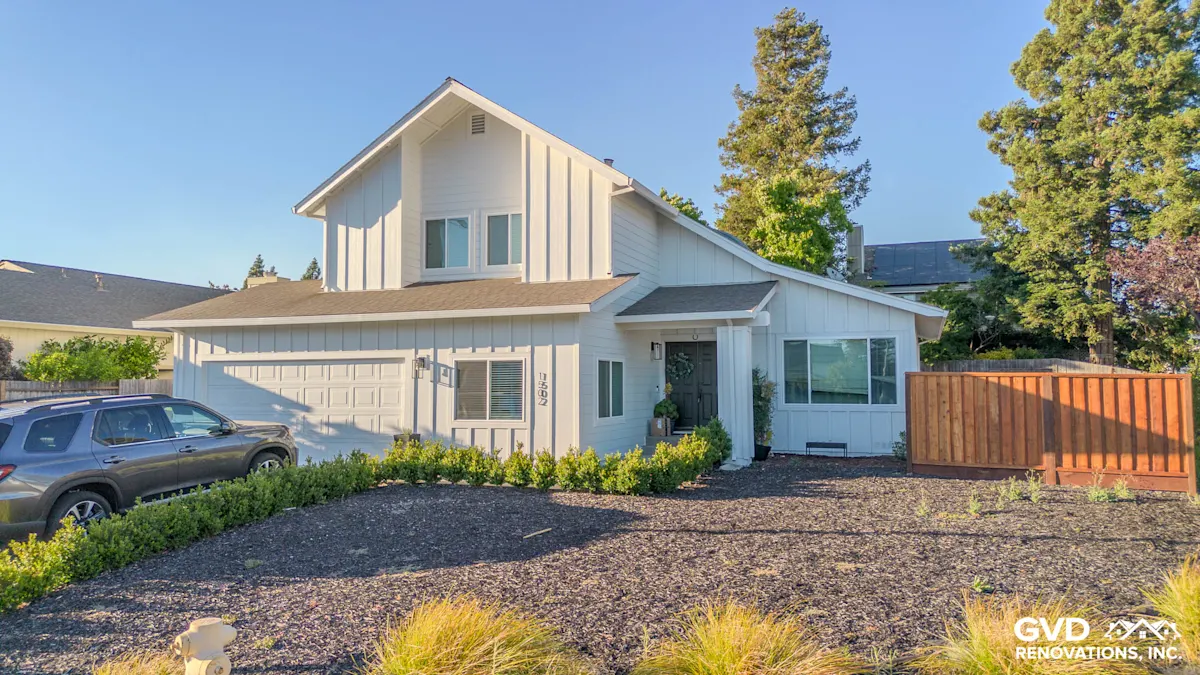
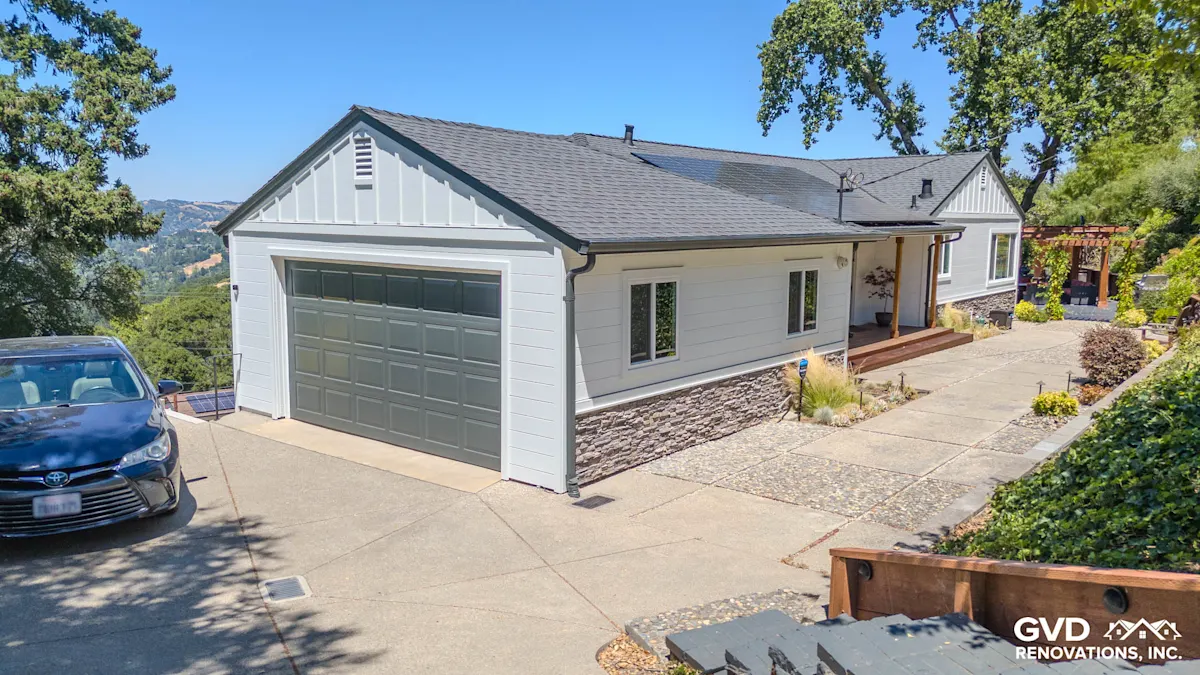
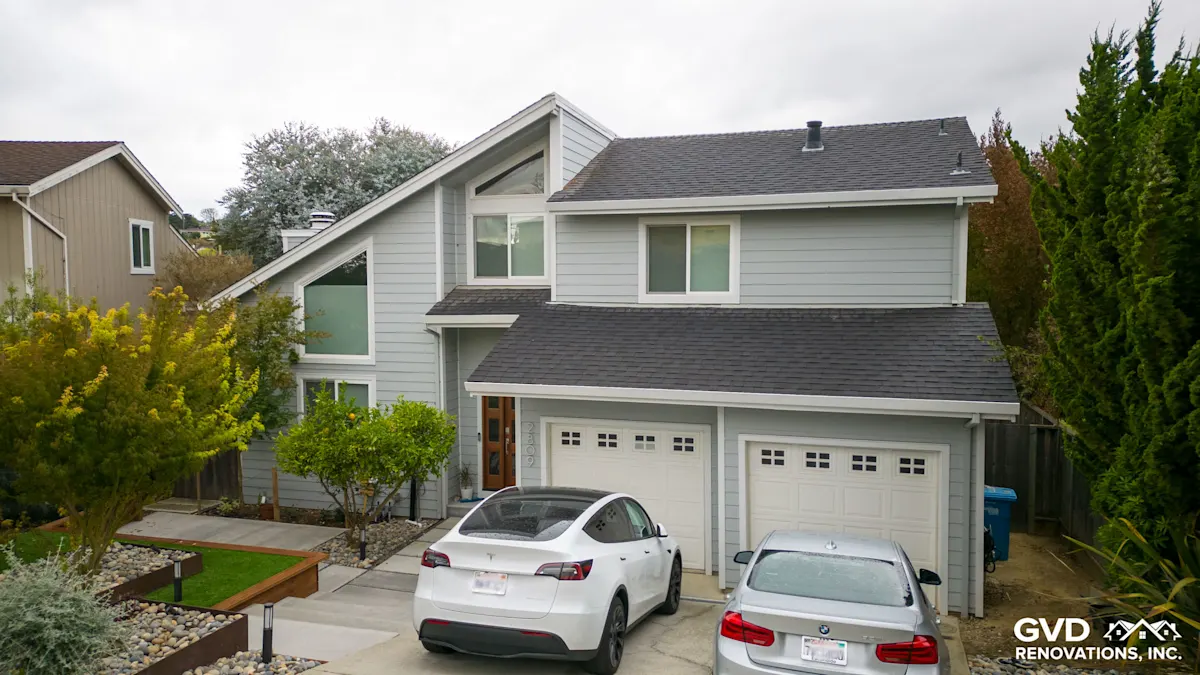
We replace siding and windows on Bay Area homes, including the older homes this study is about.
Look up your ZIP code
267 ZIP codes in the Bay Area have enough homes for a reliable estimate. Every one is in the table below and in the download.
Show all 267 ZIP codes
| ZIP | County | Homes | Median year built | Built before 1980 | Built 1980–99 |
|---|---|---|---|---|---|
| 94002 | San Mateo | 11,437 | 1966 | 83.1% ±6.1 | 10.5% |
| 94005 | San Mateo | 2,104 | 1971 | 60.5% ±16.3 | 14.8% |
| 94010 | San Mateo | 18,060 | 1960 | 78.2% ±4.0 | 11.1% |
| 94014 | San Mateo | 15,941 | 1966 | 69.5% ±4.6 | 20.4% |
| 94015 | San Mateo | 22,409 | 1964 | 83.3% ±3.9 | 12.5% |
| 94018 | San Mateo | 1,576 | 1983 | 38.8% ±17.3 | 45.2% |
| 94019 | San Mateo | 5,745 | 1979 | 51.2% ±5.4 | 27.9% |
| 94020 | San Mateo | 1,008 | 1953 | 69.3% ±16.0 | 15.6% |
| 94022 | Santa Clara | 8,144 | 1972 | 60.1% ±4.7 | 18.2% |
| 94024 | Santa Clara | 8,447 | 1962 | 78.3% ±4.2 | 9.5% |
| 94025 | San Mateo | 16,617 | 1963 | 70.2% ±4.1 | 12.0% |
| 94027 | San Mateo | 2,676 | 1960 | 61.2% ±7.8 | 11.6% |
| 94028 | San Mateo | 2,808 | 1965 | 79.7% ±10.5 | 14.8% |
| 94030 | San Mateo | 8,705 | 1962 | 76.7% ±4.7 | 12.4% |
| 94037 | San Mateo | 1,211 | 1975 | 68.1% ±16.1 | 25.7% |
| 94038 | San Mateo | 1,039 | 1971 | 78.0% ±22.8 | 22.0% |
| 94040 | Santa Clara | 17,302 | 1973 | 61.1% ±3.6 | 14.8% |
| 94041 | Santa Clara | 7,686 | 1974 | 59.7% ±5.7 | 19.0% |
| 94043 | Santa Clara | 14,794 | 1976 | 59.0% ±3.9 | 21.1% |
| 94044 | San Mateo | 14,678 | 1966 | 82.3% ±4.4 | 12.2% |
| 94060 | San Mateo | 634 | 1974 | 71.8% ±19.4 | 18.9% |
| 94061 | San Mateo | 13,838 | 1959 | 80.3% ±4.7 | 13.7% |
| 94062 | San Mateo | 10,502 | 1958 | 74.9% ±3.9 | 15.6% |
| 94063 | San Mateo | 12,259 | 1972 | 56.1% ±4.1 | 10.5% |
| 94065 | San Mateo | 4,852 | 1987 | 25.6% ±3.7 | 65.4% |
| 94066 | San Mateo | 16,433 | 1962 | 80.4% ±4.5 | 8.7% |
| 94070 | San Mateo | 11,905 | 1962 | 76.2% ±3.7 | 14.4% |
| 94080 | San Mateo | 23,654 | 1965 | 69.8% ±3.4 | 14.7% |
| 94085 | Santa Clara | 10,146 | 1988 | 35.7% ±3.7 | 34.1% |
| 94086 | Santa Clara | 21,955 | 1977 | 57.6% ±3.4 | 23.3% |
| 94087 | Santa Clara | 21,617 | 1967 | 77.3% ±3.1 | 14.4% |
| 94089 | Santa Clara | 9,521 | 1994 | 35.1% ±3.5 | 26.1% |
| 94102 | San Francisco | 23,629 | 1945 | 66.8% ±4.0 | 11.5% |
| 94103 | San Francisco | 21,609 | 1998 | 41.2% ±3.4 | 9.6% |
| 94104 | San Francisco | 301 | 1938 | 76.4% ±27.1 | 14.6% |
| 94105 | San Francisco | 10,003 | 2009 | 8.7% ±2.9 | 14.7% |
| 94107 | San Francisco | 19,605 | 2001 | 28.8% ±2.9 | 19.7% |
| 94108 | San Francisco | 7,950 | 1938 | 89.6% ±3.9 | 7.5% |
| 94109 | San Francisco | 39,490 | 1938 | 83.0% ±2.6 | 9.3% |
| 94110 | San Francisco | 30,758 | 1938 | 83.2% ±3.2 | 7.2% |
| 94111 | San Francisco | 2,968 | 1979 | 50.9% ±7.4 | 31.3% |
| 94112 | San Francisco | 24,559 | 1941 | 87.8% ±3.4 | 7.1% |
| 94114 | San Francisco | 18,771 | 1938 | 87.1% ±3.7 | 6.2% |
| 94115 | San Francisco | 19,239 | 1949 | 78.4% ±3.8 | 14.2% |
| 94116 | San Francisco | 16,546 | 1945 | 93.8% ±3.3 | 4.4% |
| 94117 | San Francisco | 19,801 | 1938 | 89.5% ±3.0 | 7.5% |
| 94118 | San Francisco | 19,266 | 1938 | 90.2% ±3.8 | 6.3% |
| 94121 | San Francisco | 19,777 | 1938 | 85.5% ±3.2 | 11.3% |
| 94122 | San Francisco | 24,208 | 1942 | 93.7% ±3.4 | 3.7% |
| 94123 | San Francisco | 15,129 | 1938 | 88.4% ±4.1 | 6.6% |
| 94124 | San Francisco | 11,700 | 1970 | 58.8% ±4.2 | 16.9% |
| 94127 | San Francisco | 7,673 | 1938 | 92.5% ±4.7 | 3.4% |
| 94129 | San Francisco | 1,428 | 1952 | 95.1% ±14.1 | 2.9% |
| 94130 | San Francisco | 740 | 1961 | 81.9% ±17.0 | 9.7% |
| 94131 | San Francisco | 13,920 | 1962 | 88.7% ±3.8 | 7.2% |
| 94132 | San Francisco | 12,039 | 1952 | 87.1% ±5.2 | 5.9% |
| 94133 | San Francisco | 15,594 | 1938 | 83.1% ±4.0 | 10.2% |
| 94134 | San Francisco | 12,850 | 1954 | 78.8% ±4.2 | 10.6% |
| 94158 | San Francisco | 5,123 | 2011 | 3.9% ±2.1 | 4.7% |
| 94301 | Santa Clara | 8,429 | 1957 | 72.5% ±5.3 | 14.1% |
| 94303 | Santa Clara | 15,891 | 1960 | 73.0% ±4.8 | 8.6% |
| 94304 | Santa Clara | 2,560 | 1996 | 30.5% ±7.3 | 24.3% |
| 94305 | Santa Clara | 4,002 | 1981 | 48.4% ±6.5 | 23.7% |
| 94306 | Santa Clara | 11,744 | 1963 | 71.9% ±4.1 | 14.1% |
| 94401 | San Mateo | 13,818 | 1964 | 70.2% ±4.9 | 20.4% |
| 94402 | San Mateo | 10,764 | 1958 | 77.5% ±3.4 | 11.4% |
| 94403 | San Mateo | 17,799 | 1965 | 69.9% ±3.8 | 14.6% |
| 94404 | San Mateo | 15,350 | 1976 | 64.4% ±3.4 | 23.5% |
| 94501 | Alameda | 27,300 | 1960 | 79.7% ±2.8 | 9.4% |
| 94502 | Alameda | 4,991 | 1984 | 33.2% ±5.4 | 63.5% |
| 94503 | Napa | 6,206 | 1997 | 27.0% ±3.7 | 26.8% |
| 94505 | Contra Costa | 6,092 | 1995 | 14.8% ±3.3 | 46.5% |
| 94506 | Contra Costa | 9,444 | 1994 | 8.1% ±3.0 | 69.2% |
| 94507 | Contra Costa | 5,343 | 1978 | 55.7% ±5.8 | 30.2% |
| 94508 | Napa | 1,186 | 1967 | 79.5% ±10.3 | 16.6% |
| 94509 | Contra Costa | 24,390 | 1975 | 63.1% ±4.2 | 26.1% |
| 94510 | Solano | 11,571 | 1981 | 45.4% ±4.6 | 46.9% |
| 94511 | Contra Costa | 1,038 | 1973 | 66.3% ±24.8 | 17.9% |
| 94513 | Contra Costa | 22,931 | 2003 | 13.3% ±2.3 | 25.2% |
| 94514 | Contra Costa | 583 | 1977 | 54.9% ±19.9 | 36.0% |
| 94515 | Sonoma | 3,124 | 1979 | 51.8% ±8.2 | 29.8% |
| 94517 | Contra Costa | 4,519 | 1983 | 46.7% ±5.2 | 43.9% |
| 94518 | Contra Costa | 10,317 | 1970 | 77.4% ±4.8 | 17.8% |
| 94519 | Contra Costa | 7,484 | 1960 | 84.4% ±7.7 | 7.8% |
| 94520 | Contra Costa | 14,085 | 1971 | 72.2% ±4.6 | 19.0% |
| 94521 | Contra Costa | 16,451 | 1974 | 68.4% ±3.6 | 25.1% |
| 94523 | Contra Costa | 14,133 | 1972 | 62.3% ±4.2 | 28.6% |
| 94525 | Contra Costa | 1,713 | 1938 | 82.5% ±9.2 | 8.1% |
| 94526 | Contra Costa | 12,185 | 1976 | 65.2% ±4.4 | 29.9% |
| 94528 | Contra Costa | 463 | 1980 | 50.1% ±29.0 | 32.4% |
| 94530 | Contra Costa | 11,437 | 1956 | 81.7% ±4.3 | 9.3% |
| 94531 | Contra Costa | 14,239 | 1997 | 3.5% ±1.1 | 57.7% |
| 94533 | Solano | 26,060 | 1979 | 52.0% ±3.0 | 27.3% |
| 94534 | Solano | 14,481 | 1994 | 17.9% ±2.4 | 46.8% |
| 94535 | Solano | 1,412 | 1998 | 14.2% ±6.9 | 40.8% |
| 94536 | Alameda | 26,533 | 1975 | 62.4% ±3.1 | 26.7% |
| 94538 | Alameda | 24,854 | 1979 | 52.1% ±2.5 | 29.7% |
| 94539 | Alameda | 18,127 | 1980 | 49.5% ±2.7 | 32.4% |
| 94541 | Alameda | 22,934 | 1969 | 63.2% ±3.5 | 22.6% |
| 94542 | Alameda | 5,201 | 1980 | 50.0% ±6.2 | 33.4% |
| 94544 | Alameda | 24,194 | 1970 | 67.3% ±3.0 | 21.2% |
| 94545 | Alameda | 10,373 | 1973 | 61.6% ±4.9 | 18.4% |
| 94546 | Alameda | 16,233 | 1960 | 75.8% ±3.6 | 17.6% |
| 94547 | Contra Costa | 9,581 | 1988 | 16.2% ±2.9 | 56.7% |
| 94549 | Contra Costa | 11,057 | 1962 | 76.5% ±5.2 | 13.4% |
| 94550 | Alameda | 18,443 | 1978 | 54.4% ±3.1 | 24.1% |
| 94551 | Alameda | 14,290 | 1980 | 49.7% ±4.1 | 31.9% |
| 94552 | Alameda | 5,088 | 1988 | 28.9% ±3.8 | 64.4% |
| 94553 | Contra Costa | 19,677 | 1975 | 60.0% ±3.9 | 32.0% |
| 94555 | Alameda | 12,066 | 1983 | 38.2% ±3.5 | 50.9% |
| 94556 | Contra Costa | 5,801 | 1972 | 77.1% ±5.9 | 16.2% |
| 94558 | Napa | 27,493 | 1976 | 59.8% ±3.0 | 26.0% |
| 94559 | Napa | 11,661 | 1967 | 66.8% ±3.5 | 14.7% |
| 94560 | Alameda | 16,015 | 1975 | 58.6% ±3.7 | 23.3% |
| 94561 | Contra Costa | 14,603 | 1995 | 15.3% ±3.6 | 45.3% |
| 94563 | Contra Costa | 7,416 | 1960 | 81.9% ±6.4 | 10.6% |
| 94564 | Contra Costa | 7,056 | 1970 | 69.6% ±7.6 | 22.7% |
| 94565 | Contra Costa | 31,396 | 1983 | 44.1% ±2.6 | 33.7% |
| 94566 | Alameda | 16,724 | 1982 | 43.9% ±3.2 | 36.6% |
| 94568 | Alameda | 25,157 | 2004 | 19.4% ±1.9 | 20.5% |
| 94571 | Solano | 5,361 | 2001 | 21.6% ±4.7 | 23.9% |
| 94572 | Contra Costa | 3,190 | 1972 | 77.7% ±8.0 | 14.1% |
| 94574 | Napa | 4,135 | 1972 | 63.0% ±7.1 | 24.6% |
| 94577 | Alameda | 17,494 | 1959 | 73.0% ±3.4 | 17.9% |
| 94578 | Alameda | 14,672 | 1963 | 79.4% ±4.8 | 15.7% |
| 94579 | Alameda | 6,850 | 1958 | 81.5% ±7.4 | 15.5% |
| 94580 | Alameda | 9,207 | 1955 | 86.7% ±4.6 | 7.3% |
| 94582 | Contra Costa | 16,781 | 2003 | 3.5% ±1.0 | 34.7% |
| 94583 | Contra Costa | 14,345 | 1981 | 48.6% ±3.5 | 36.9% |
| 94585 | Solano | 9,822 | 1984 | 38.9% ±4.9 | 44.9% |
| 94586 | Alameda | 359 | 1964 | 71.9% ±10.0 | 15.0% |
| 94587 | Alameda | 21,901 | 1980 | 51.5% ±3.3 | 31.8% |
| 94588 | Alameda | 12,797 | 1986 | 36.5% ±3.1 | 45.5% |
| 94589 | Solano | 9,996 | 1974 | 66.7% ±5.7 | 29.9% |
| 94590 | Solano | 16,827 | 1960 | 76.2% ±4.7 | 17.7% |
| 94591 | Solano | 20,838 | 1983 | 42.6% ±2.7 | 44.0% |
| 94592 | Solano | 505 | 2005 | 9.7% ±12.8 | 2.2% |
| 94595 | Contra Costa | 9,828 | 1970 | 73.6% ±4.2 | 21.9% |
| 94596 | Contra Costa | 11,461 | 1976 | 60.0% ±4.9 | 19.9% |
| 94597 | Contra Costa | 11,249 | 1981 | 46.6% ±4.3 | 36.2% |
| 94598 | Contra Costa | 10,928 | 1972 | 77.8% ±5.0 | 17.9% |
| 94599 | Napa | 1,850 | 1986 | 38.8% ±95.1 | 39.8% |
| 94601 | Alameda | 17,631 | 1948 | 81.7% ±4.5 | 9.7% |
| 94602 | Alameda | 13,192 | 1938 | 87.6% ±3.5 | 7.9% |
| 94603 | Alameda | 11,133 | 1950 | 82.4% ±5.2 | 7.7% |
| 94605 | Alameda | 17,618 | 1952 | 81.3% ±4.1 | 11.3% |
| 94606 | Alameda | 17,905 | 1954 | 79.8% ±3.5 | 11.8% |
| 94607 | Alameda | 15,116 | 1978 | 51.8% ±3.5 | 13.8% |
| 94608 | Alameda | 18,319 | 1972 | 59.1% ±3.2 | 14.4% |
| 94609 | Alameda | 12,042 | 1938 | 77.6% ±4.6 | 6.4% |
| 94610 | Alameda | 18,221 | 1955 | 90.3% ±4.3 | 6.8% |
| 94611 | Alameda | 19,726 | 1959 | 78.5% ±3.6 | 11.8% |
| 94612 | Alameda | 12,949 | 1978 | 51.5% ±4.1 | 8.7% |
| 94618 | Alameda | 8,052 | 1946 | 75.1% ±4.5 | 16.6% |
| 94619 | Alameda | 10,286 | 1946 | 82.3% ±4.9 | 10.5% |
| 94621 | Alameda | 11,063 | 1952 | 78.7% ±5.9 | 8.5% |
| 94702 | Alameda | 8,388 | 1944 | 85.3% ±4.6 | 6.0% |
| 94703 | Alameda | 9,750 | 1946 | 80.9% ±5.3 | 8.1% |
| 94704 | Alameda | 9,971 | 1966 | 68.7% ±6.3 | 13.3% |
| 94705 | Alameda | 6,474 | 1938 | 82.9% ±4.7 | 12.0% |
| 94706 | Alameda | 8,447 | 1950 | 79.6% ±4.3 | 10.2% |
| 94707 | Alameda | 5,410 | 1938 | 94.3% ±4.9 | 3.7% |
| 94708 | Contra Costa | 5,105 | 1944 | 90.7% ±4.8 | 6.2% |
| 94709 | Alameda | 6,326 | 1942 | 84.6% ±5.9 | 10.8% |
| 94710 | Alameda | 4,188 | 1966 | 59.2% ±6.1 | 9.2% |
| 94720 | Alameda | 412 | 1949 | 69.2% ±29.7 | 2.2% |
| 94801 | Contra Costa | 11,075 | 1970 | 60.8% ±5.1 | 20.4% |
| 94803 | Contra Costa | 10,127 | 1972 | 65.7% ±5.2 | 27.0% |
| 94804 | Contra Costa | 16,962 | 1959 | 74.4% ±5.2 | 17.4% |
| 94805 | Contra Costa | 5,908 | 1951 | 91.4% ±6.6 | 6.5% |
| 94806 | Contra Costa | 21,101 | 1970 | 61.7% ±4.0 | 20.5% |
| 94901 | Marin | 16,233 | 1965 | 76.4% ±4.8 | 16.1% |
| 94903 | Marin | 12,665 | 1968 | 71.5% ±5.4 | 22.4% |
| 94904 | Marin | 5,975 | 1963 | 85.2% ±6.2 | 10.8% |
| 94920 | Marin | 5,816 | 1969 | 75.3% ±7.2 | 16.0% |
| 94923 | Sonoma | 1,473 | 1983 | 43.6% ±11.5 | 36.4% |
| 94924 | Marin | 1,068 | 1965 | 77.4% ±11.4 | 18.8% |
| 94925 | Marin | 4,171 | 1962 | 76.3% ±9.5 | 14.6% |
| 94928 | Sonoma | 17,826 | 1982 | 43.1% ±3.6 | 41.9% |
| 94929 | Marin | 468 | 1978 | 53.8% ±21.9 | 19.7% |
| 94930 | Marin | 3,729 | 1954 | 88.2% ±9.5 | 9.2% |
| 94931 | Sonoma | 4,134 | 1982 | 43.3% ±7.7 | 40.6% |
| 94933 | Marin | 601 | 1954 | 73.5% ±23.2 | 18.5% |
| 94937 | Marin | 836 | 1961 | 72.8% ±16.0 | 20.5% |
| 94938 | Marin | 300 | 1965 | 83.7% ±30.4 | 16.3% |
| 94939 | Marin | 3,676 | 1972 | 68.0% ±8.2 | 23.4% |
| 94941 | Marin | 14,315 | 1962 | 79.4% ±4.4 | 13.7% |
| 94945 | Marin | 7,343 | 1973 | 67.9% ±5.7 | 17.9% |
| 94946 | Marin | 311 | 1974 | 64.6% ±11.1 | 30.2% |
| 94947 | Marin | 9,369 | 1971 | 75.5% ±5.7 | 17.9% |
| 94949 | Marin | 7,359 | 1980 | 49.3% ±5.4 | 29.1% |
| 94951 | Sonoma | 1,548 | 1974 | 60.6% ±13.3 | 22.5% |
| 94952 | Marin | 14,908 | 1965 | 70.7% ±4.7 | 17.4% |
| 94954 | Sonoma | 15,249 | 1985 | 40.0% ±2.9 | 40.0% |
| 94956 | Marin | 918 | 1975 | 55.4% ±11.7 | 40.7% |
| 94957 | Marin | 791 | 1938 | 83.2% ±12.3 | 2.9% |
| 94960 | Marin | 6,882 | 1955 | 86.5% ±6.4 | 9.0% |
| 94965 | Marin | 6,709 | 1968 | 80.1% ±6.0 | 15.9% |
| 94970 | Marin | 693 | 1980 | 49.6% ±15.4 | 32.9% |
| 94973 | Marin | 674 | 1953 | 95.5% ±11.8 | 4.5% |
| 95002 | Santa Clara | 559 | 2000 | 33.6% ±11.8 | 16.5% |
| 95008 | Santa Clara | 20,353 | 1972 | 68.0% ±3.6 | 21.0% |
| 95014 | Santa Clara | 23,104 | 1973 | 64.0% ±3.3 | 21.9% |
| 95020 | Santa Clara | 20,822 | 1987 | 38.0% ±3.1 | 29.7% |
| 95030 | Santa Clara | 5,837 | 1968 | 69.5% ±5.7 | 17.9% |
| 95032 | Santa Clara | 10,966 | 1972 | 71.7% ±5.3 | 15.7% |
| 95035 | Santa Clara | 26,098 | 1987 | 39.7% ±2.3 | 25.7% |
| 95037 | Santa Clara | 17,571 | 1989 | 36.5% ±2.8 | 32.1% |
| 95046 | Santa Clara | 1,855 | 1975 | 63.1% ±12.5 | 22.7% |
| 95050 | Santa Clara | 16,804 | 1965 | 71.0% ±4.2 | 13.9% |
| 95051 | Santa Clara | 25,655 | 1971 | 64.6% ±2.6 | 12.1% |
| 95054 | Santa Clara | 10,508 | 2002 | 25.1% ±2.9 | 17.9% |
| 95070 | Santa Clara | 11,887 | 1968 | 76.4% ±4.9 | 13.3% |
| 95110 | Santa Clara | 7,621 | 1985 | 45.3% ±5.0 | 15.0% |
| 95111 | Santa Clara | 16,166 | 1977 | 57.8% ±3.9 | 25.0% |
| 95112 | Santa Clara | 23,628 | 1969 | 57.8% ±3.5 | 11.3% |
| 95113 | Santa Clara | 1,842 | 2008 | 10.1% ±6.4 | 6.9% |
| 95116 | Santa Clara | 13,978 | 1972 | 63.0% ±4.3 | 23.9% |
| 95117 | Santa Clara | 11,366 | 1967 | 82.4% ±5.9 | 11.5% |
| 95118 | Santa Clara | 12,011 | 1968 | 80.8% ±4.4 | 14.1% |
| 95119 | Santa Clara | 3,683 | 1976 | 73.4% ±4.9 | 14.4% |
| 95120 | Santa Clara | 12,981 | 1976 | 66.9% ±2.9 | 28.8% |
| 95121 | Santa Clara | 10,005 | 1976 | 72.1% ±3.5 | 21.6% |
| 95122 | Santa Clara | 12,465 | 1971 | 73.2% ±4.6 | 20.1% |
| 95123 | Santa Clara | 25,037 | 1976 | 62.1% ±2.3 | 19.9% |
| 95124 | Santa Clara | 18,175 | 1964 | 86.7% ±4.4 | 7.0% |
| 95125 | Santa Clara | 22,000 | 1965 | 71.1% ±3.2 | 12.9% |
| 95126 | Santa Clara | 17,222 | 1984 | 46.4% ±3.1 | 15.9% |
| 95127 | Santa Clara | 16,257 | 1964 | 78.5% ±3.5 | 14.6% |
| 95128 | Santa Clara | 14,951 | 1968 | 69.9% ±4.6 | 13.0% |
| 95129 | Santa Clara | 15,087 | 1966 | 82.5% ±4.7 | 11.3% |
| 95130 | Santa Clara | 5,128 | 1964 | 89.8% ±6.1 | 5.3% |
| 95131 | Santa Clara | 10,308 | 1986 | 32.2% ±3.2 | 50.0% |
| 95132 | Santa Clara | 12,477 | 1974 | 82.9% ±3.5 | 12.9% |
| 95133 | Santa Clara | 9,671 | 1983 | 43.7% ±3.9 | 23.8% |
| 95134 | Santa Clara | 14,752 | 2008 | 7.6% ±1.6 | 26.3% |
| 95135 | Santa Clara | 7,764 | 1990 | 25.8% ±3.3 | 56.9% |
| 95136 | Santa Clara | 16,730 | 1981 | 47.5% ±3.3 | 28.5% |
| 95138 | Santa Clara | 5,729 | 1995 | 12.9% ±2.8 | 60.6% |
| 95139 | Santa Clara | 2,195 | 1975 | 82.6% ±5.3 | 15.9% |
| 95148 | Santa Clara | 12,369 | 1981 | 47.0% ±3.6 | 42.0% |
| 95391 | Alameda | 7,412 | 2011 | 7.5% ±5.7 | 2.6% |
| 95401 | Sonoma | 14,384 | 1979 | 52.0% ±4.3 | 33.9% |
| 95403 | Sonoma | 17,832 | 1986 | 34.1% ±3.3 | 39.4% |
| 95404 | Sonoma | 16,861 | 1973 | 59.5% ±3.1 | 17.1% |
| 95405 | Sonoma | 9,651 | 1972 | 73.9% ±4.6 | 19.8% |
| 95407 | Sonoma | 13,494 | 1991 | 36.1% ±3.5 | 27.2% |
| 95409 | Sonoma | 12,280 | 1978 | 55.3% ±3.8 | 29.0% |
| 95421 | Sonoma | 1,145 | 1970 | 70.5% ±7.3 | 18.2% |
| 95425 | Sonoma | 4,480 | 1977 | 54.5% ±8.3 | 23.6% |
| 95436 | Sonoma | 2,687 | 1959 | 75.8% ±9.4 | 11.9% |
| 95441 | Sonoma | 902 | 1980 | 49.8% ±8.4 | 33.9% |
| 95442 | Sonoma | 1,781 | 1964 | 70.7% ±17.2 | 19.5% |
| 95446 | Sonoma | 3,252 | 1957 | 79.5% ±7.9 | 12.9% |
| 95448 | Sonoma | 7,716 | 1978 | 52.7% ±4.8 | 28.2% |
| 95450 | Sonoma | 311 | 1970 | 63.0% ±19.3 | 26.7% |
| 95452 | Sonoma | 757 | 1963 | 75.3% ±14.4 | 18.5% |
| 95462 | Sonoma | 960 | 1957 | 87.5% ±12.0 | 9.8% |
| 95465 | Sonoma | 1,091 | 1975 | 62.8% ±14.2 | 25.5% |
| 95471 | Sonoma | 498 | 1938 | 90.6% ±25.6 | 6.8% |
| 95472 | Sonoma | 12,612 | 1972 | 71.1% ±4.2 | 22.1% |
| 95476 | Sonoma | 17,223 | 1976 | 59.2% ±4.1 | 28.8% |
| 95492 | Sonoma | 10,128 | 1992 | 16.5% ±2.7 | 60.9% |
| 95497 | Sonoma | 1,853 | 1987 | 32.9% ±6.7 | 48.8% |
| 95620 | Solano | 8,080 | 1987 | 40.6% ±7.1 | 31.6% |
| 95687 | Solano | 23,876 | 1986 | 36.1% ±3.0 | 42.7% |
| 95688 | Solano | 14,915 | 1982 | 47.3% ±3.6 | 30.9% |
What your home's age can mean for a remodel
A build year doesn't tell you what's inside a particular house: many older homes have been rewired, re-sided or re-roofed. But it tells you what to check before work starts. These are the dates that matter most, with the official source for each.
Lead-based paint
The federal government banned lead-based paint for homes in 1978, and EPA says homes built before then probably contain it. A contractor paid for work that disturbs paint in a pre-1978 home (sanding, cutting, removing siding, trim or windows) must be an EPA-certified firm and follow lead-safe work practices.
Aluminum branch wiring
CPSC says cables installed between 1965 and the mid-1970s, in new homes, additions and rewired circuits, may be aluminum, and that homes built before 1965 are unlikely to have it. If a remodel opens walls in a house from these years, have an electrician check the wiring.
Built before the state energy code
Homes built earlier were not designed to any state energy standard. Many have been upgraded since, but in an older home it is worth checking the attic insulation, original single-pane windows and duct leaks before you plan a remodel.
Asbestos in building materials
Asbestos was used in products such as cement siding, floor tiles and textured ceilings. EPA says you can't tell by looking, and suggests an inspection by an accredited professional if you plan to remodel. Removal must be done by a licensed abatement contractor. More in our guide to asbestos siding.
Hardboard siding
The Masonite class action covered hardboard siding installed from January 1, 1980 to January 15, 1998. If your house is from those years and still has its original wood-look lap siding, check whether it is hardboard. See Masonite siding problems, hardboard siding and T1-11 siding.
Built before the wildfire building code
California's wildfire construction rules (Chapter 7A of the state building code) began applying to new homes in fire hazard severity zones in 2008. Homes built earlier in those zones weren't built to them; siding, vents, eaves and windows are where most of the difference is. See our wildfire defense page.
What this means for Bay Area homeowners
Most Bay Area homes are older than lead paint rules and the state energy code. With 62.7% of homes built before 1980, the lead-safe work and asbestos checks above apply to most exterior projects in the region, from siding and trim to window replacement.
Older exteriors are where the work is. Homes this age often still have original wood siding, single-pane windows or many layers of paint. If you are planning to replace siding, see our siding replacement and James Hardie siding pages.
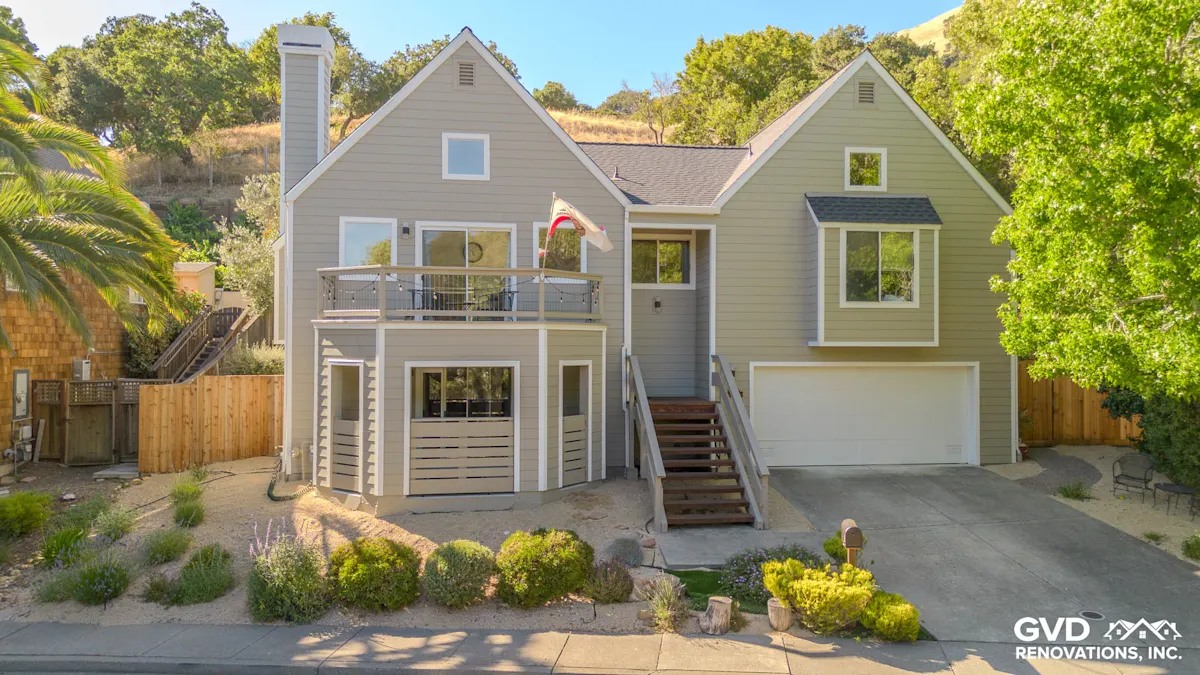
Homes near open land were built before the wildfire rules. 91.9% of Bay Area homes were built before 2010, and California's wildfire construction rules only began applying to new homes in fire hazard zones in 2008. If yours is in the hills or near open space, see our wildfire defense page for what changes when siding or vents are replaced.
Method
Data. U.S. Census Bureau, American Community Survey (ACS) 2020–2024 5-year estimates, the newest release, from the Census Bureau's table-based summary files (downloaded 2026-11-19): table B25034 (year structure built), B25035 (median year built), B25036 (owner or renter by year built), B25127 (year built by units in structure) and B25004 (vacancy status).
Area. The nine Bay Area counties: Alameda, Contra Costa, Marin, Napa, San Francisco, San Mateo, Santa Clara, Solano and Sonoma. The Bay Area row adds the nine county estimates together. Cities and communities in more than one county are listed under each county they touch.
ZIP codes are Census ZIP Code Tabulation Areas (ZCTAs), which closely match but are not identical to postal ZIP codes. Each ZIP is listed under the county holding most of its land area (Census 2020 ZCTA-to-county relationship file). Cities and communities are Census places: incorporated cities and towns, and Census-designated places for unincorporated communities.
Calculations. "Built before 1980" adds the 1970s and every earlier decade. Shares use all housing units as the base, including vacant homes. Margins of error for sums and shares use the Census Bureau's standard approximation formulas. A script computes every figure from the raw files; we checked the published numbers a second time against Census Reporter's copy of the same 2024 tables, and the results matched exactly.
Limits
- ACS figures are estimates from a survey sample, averaged over 2020 to 2024. The fewer homes a place has, the less certain its numbers are, so we show the margin of error and leave out places with fewer than 300 homes.
- The build year comes from the people who answered the survey, and many of them guess, so decades are more reliable than single years.
- The age of a house says nothing about later work. A 1975 home may have new siding, windows and wiring.
- The Census groups years by decade, so we can show "before 1980" but not exactly "before 1978", the lead paint cutoff.
- The Bay Area total is a sum of counties, so it has no median year built and its margins of error are approximate.
Download the data and cite this study
The full table (every county, city, community and ZIP code, with margins of error and owner and renter breakdowns) can be used by anyone under a CC BY 4.0 license. Please credit GVD Renovations and link to this page.
Download CSVFound an error? Tell us with the source; we'll fix it and add a dated note on this page.
Sources
- U.S. Census Bureau, American Community Survey summary file
- EPA, Protect Your Family from Sources of Lead
- EPA, Lead Renovation, Repair and Painting Program Rules
- EPA, Protect Your Family from Exposures to Asbestos
- CPSC Publication 516, Repairing Aluminum Wiring
- California Energy Commission, 2025 Energy Code summary
- Lieff Cabraser (class counsel), Masonite hardboard siding settlement
- California Building Code Chapter 7A (2010 edition, via HCD)