Research: Northern California homes, by the numbers
How old are the homes in your city or ZIP code, and what does that mean for the siding, windows, wiring and paint? These studies answer that for the Sacramento region, Lake Tahoe and Truckee, and the Bay Area, using the Census Bureau's own housing counts.
We're a remodeling company, not a research firm. We publish these because a home's build year tells you what to check before work starts, and the same numbers help homeowners, real estate agents, inspectors and reporters. The figures cover counties, cities and ZIP codes only, never a particular home or person.
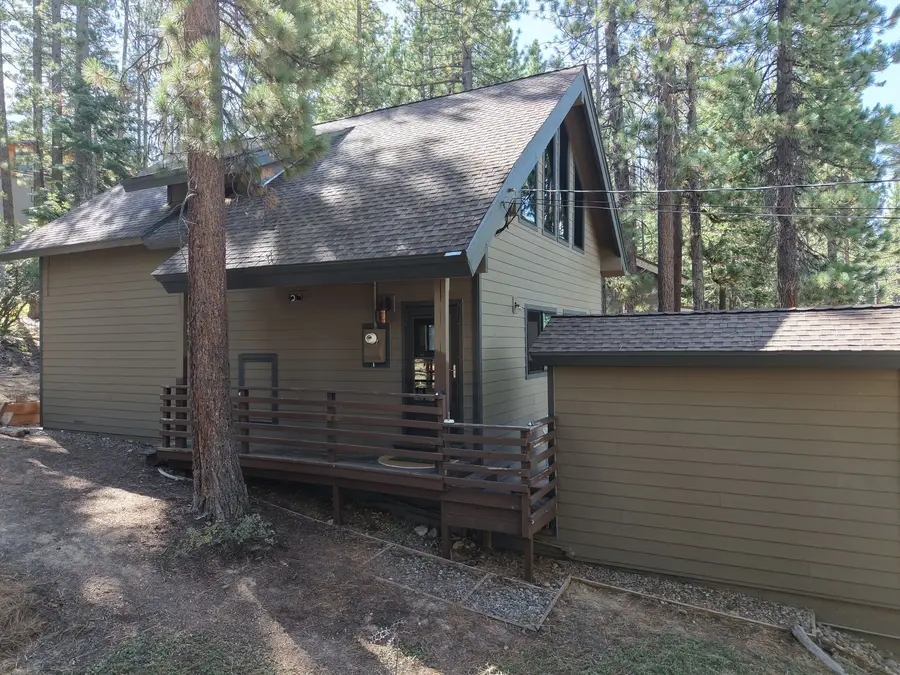
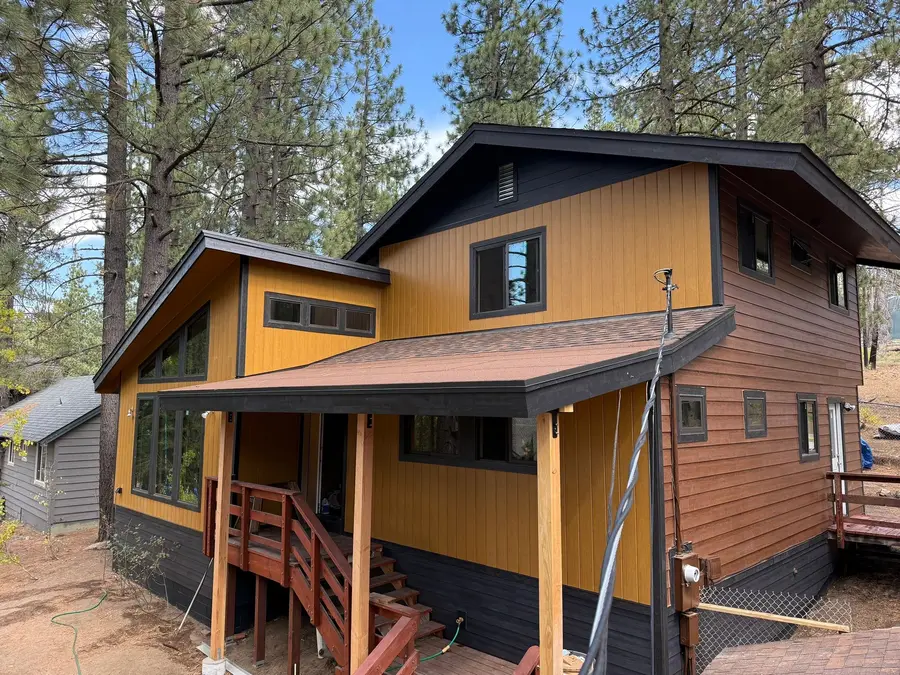
The three regions side by side
The same Census tables, measured the same way for each region. Shares are of all homes, including vacant ones.
| Region | Homes | Before 1980 | 1980–1999 | Second homes |
|---|---|---|---|---|
Sacramento region Sacramento, Placer, El Dorado and Yolo counties | 954,751 | 43.9% | 29.9% | 3.5% |
Tahoe–Truckee Truckee and the California side of Lake Tahoe | 60,378 | 56.7% | 26.1% | 53.2% |
Bay Area the nine Bay Area counties | 3,007,420 | 62.7% | 20.7% | 1.2% |
Source: U.S. Census Bureau, American Community Survey 2020–2024 5-year estimates. Each study has the margins of error, the county, city and ZIP code detail, and its own limits.
Use our data
Writing about local housing or advising buyers? Take the spreadsheets. Each one has every county, city and ZIP code in its study, with margins of error. Anyone can use them under a CC BY 4.0 license; please link to the study you quote. Each study page has a citation you can copy.
Our method
We download the Census Bureau’s American Community Survey 2020–2024 5-year summary files ourselves and run them through one script, so every region is measured the same way. “Built before 1980” adds up the 1970s and every decade before it, out of all homes, vacant ones included. Places and ZIP codes with fewer than 300 homes are left out because their estimates are too shaky to be useful.
Before publishing, we compare our numbers with Census Reporter’s copy of the same tables. Each study spells out its method and what the data can’t tell you. If something looks wrong, let us know and we’ll fix it and say when.
Sources
- U.S. Census Bureau, American Community Survey 2020–2024 5-year summary files
- Census Reporter (second check of the same tables)
- CAL FIRE / Office of the State Fire Marshal, Fire Hazard Severity Zones
- California Department of Insurance, residential policies by ZIP code
- EPA, Lead Renovation, Repair and Painting Program Rules
- EPA, Protect Your Family from Exposures to Asbestos
- CPSC Publication 516, Repairing Aluminum Wiring
- California Energy Commission, 2025 Energy Code summary
- California Building Code Chapter 7A (2010 edition, via HCD)
- Lieff Cabraser (class counsel), Masonite hardboard siding settlement